Crashmap: Difference between revisions
Jump to navigation
Jump to search
imported>Heather Drugge No edit summary |
imported>Heather Drugge No edit summary |
||
| Line 3: | Line 3: | ||
[[File:HotRoutes North Vancouver2.png]] |
[[File:HotRoutes North Vancouver2.png]] |
||
This information interprets crash information from the [ |
This information interprets crash information from the [https://public.tableau.com/profile/icbc#!/vizhome/BC-CrashesinvolvingCyclists-/CyclistsDashboard ICBC website]. |
||
ICBC |
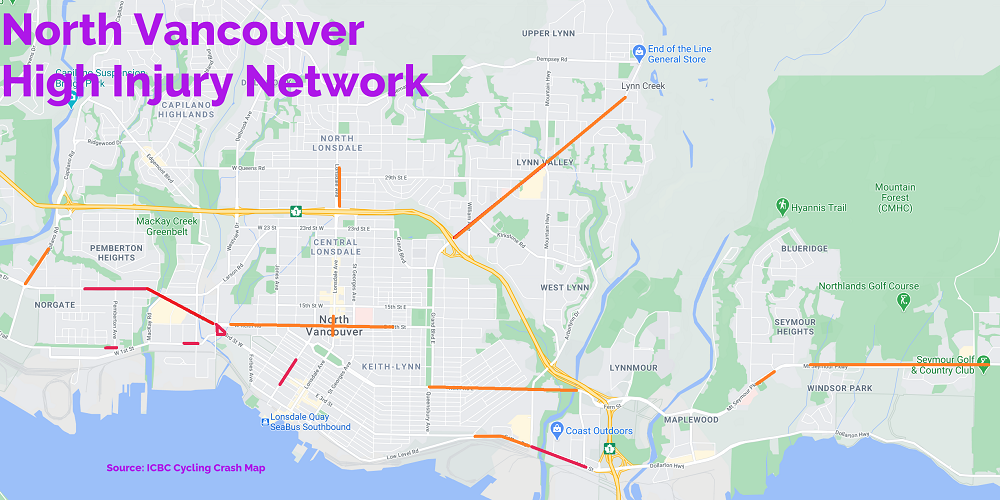
ICBC counted the crashes involving cyclists forfive years, from 2015 to 2019. Even more interesting are the actual counts in different locations. |
||
This data set is from the five years 2015 to 2019. Even more interesting are the actual counts in different locations. |
|||
Marine Drive and Main Street are high injury locations. No surprises there. But so was lower Chesterfield, which is surprising. |
Marine Drive and Main Street are high injury locations. No surprises there. But so was lower Chesterfield, which is surprising. |
||
The .pdf file below lists all the locations where crashes took place in North Vancouver. |
The .pdf file below lists all the locations where crashes took place in North Vancouver. |
||
[[File:Crash Locations - North Van.pdf]] |
[[File:Crash Locations - North Van.pdf]] |
||
Revision as of 01:08, 12 March 2021
This information interprets crash information from the ICBC website. ICBC counted the crashes involving cyclists forfive years, from 2015 to 2019. Even more interesting are the actual counts in different locations. Marine Drive and Main Street are high injury locations. No surprises there. But so was lower Chesterfield, which is surprising. The .pdf file below lists all the locations where crashes took place in North Vancouver.
